Multiple Axes
The previous tutorial explained about best practices of data visualization in terms of Data Analysis. Another way to show a variety of series in one chart without overlaps and mess is combining multiple axes in Layered / Stacked / Segmented layout for better view organization.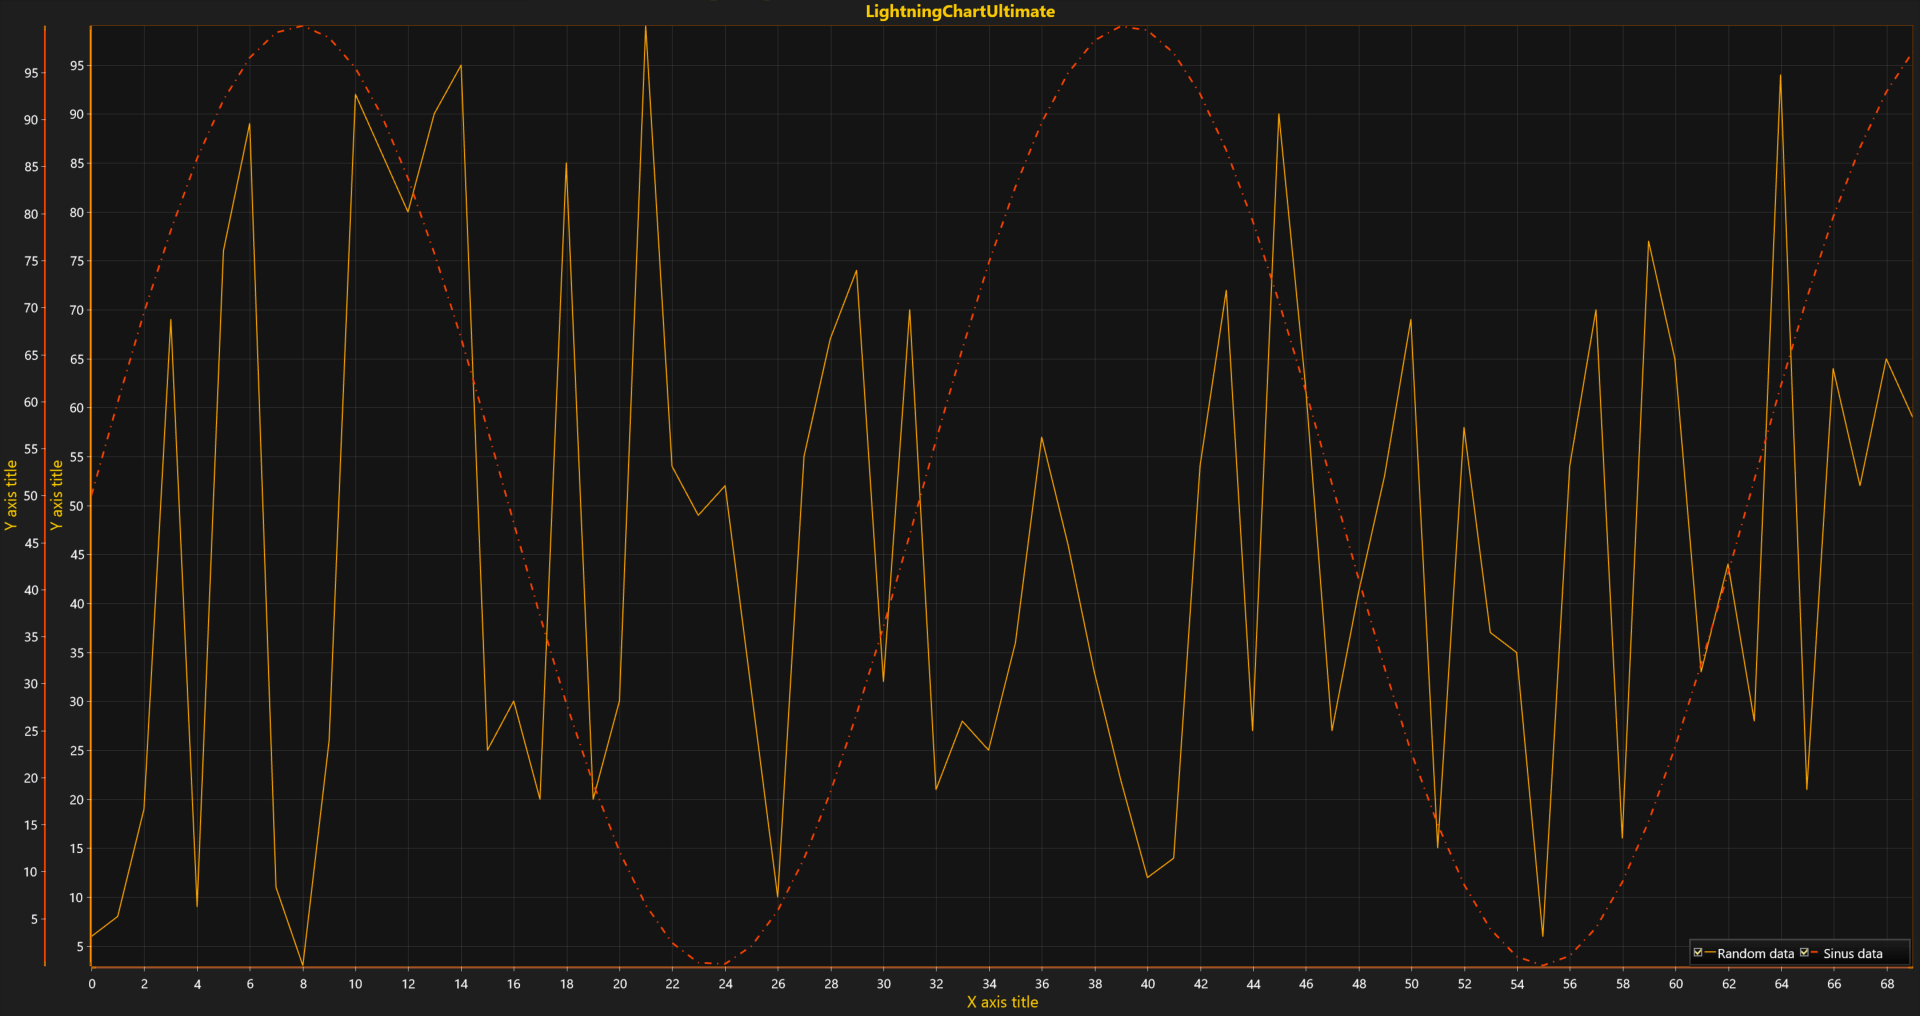 This tutorial will show how to create additional Y-axes and assign line series to different axes. Modify the code from the previous article. Add a new Y-axis before a block with line series initialization ("series2") according to the following steps below.
- Create new axis with information about 2D View.
// New y-axis instance assigned to XY layout.
var axisY = new AxisY(chart.ViewXY);
Configure and set options.
// Configure (e.g. Color).
axisY.AxisColor = Color.FromArgb(255, 255, 255, 0);
Make created axis a part of a chart.
// Add the y-axis into list of YAxes.
chart.ViewXY.YAxes.Add(axisY);
Having multiple X or Y axes, a user can assign each data series to an individual axis during either series instance declaration or after that by changing special properties.
Declare a new instance of a series and send references to the axes objects as arguments to the constructor.
var series2 = new PointLineSeries (
    chart.ViewXY,
    chart.ViewXY.XAxes[0],
    axisY
);
or
var series2 = new PointLineSeries (
    chart.ViewXY,
    chart.ViewXY.XAxes[0],
    chart.ViewXY.YAxes[1]
);
Declare a new instance of a series with an empty (default) constructor and assign indexes to desired axes manually at any time during your application execution.
var series2 = new PointLineSeries();
series2.AssignXAxisIndex = 0; // Assign to the 1st x-axis.
series2.AssignYAxisIndex = 1; // Assign to the 2nd y-axis.
Layout and axes configuration features such as placement, alignment, and layout location (Layered - default, Stacked, Segmented) will be explained in further tutorials.